
Where this sits
The GTM Engine is the execution layer of a longer architecture:
Strategy → Data Foundation → Operating System → Cadence → Scorecard.
The upstream work matters. Without a strategy that has made real choices on segments, motions, and buyers, and a data foundation that reflects those choices in something measurable, the engine will run confidently in the wrong direction. Assume both exist before building.
What follows is the operating system, the cadence, and the scorecard. The practical middle that most organisations get wrong by building it backwards.
The problem
Most enterprise GTM organisations are running the same structural failure in parallel. At the top, leadership wants a handful of signals that tell them whether the business is healthy. At the bottom, sellers and front-line managers need specific, actionable metrics tied to their accounts and their pipeline. In the middle sits RevOps, trying to serve both audiences, and usually serving neither.
The common outcome is one of two failure modes. You either stay at the strategic level with a handful of KPIs that are too disconnected from execution to drive behaviour. Or you build sprawling dashboards that capture everything and get looked at by nobody in leadership. Either way, when an overlay function decides they need 15 extra metrics with their own cut of the data, you’ve lost. You’ve created a measurement system that nobody owns and everyone tolerates.
The engine solves this by making hierarchy the architecture. The complexity of the business is real, and pretending otherwise creates different problems, so the goal isn’t simplification. It’s giving every level of the organisation a coherent view of the same commercial machine, at the resolution appropriate to their role.
The engine architecture
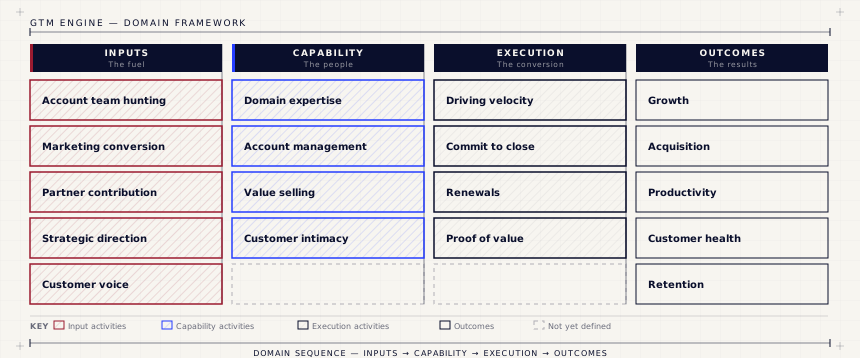
The GTM Engine organises the entire commercial motion into four sequential stages, each feeding the next:
Inputs → Capability → Execution → Outcomes
Inputs are the raw materials the engine needs to function: seller-sourced pipeline, marketing-generated demand, partner contributions, and the strategic direction that sets the context for all three. Without quality inputs, even a capable, well-managed team is working against a ceiling.
Capability is the multiplier. Given the same inputs, a higher-capability field organisation produces better outcomes. Capability domains cover the behaviours and competencies that matter most at any given point: the ability to articulate strategic positioning, quality of account planning, value selling fluency, seller productivity, and depth of customer engagement. These are measured domains with defined KPIs, not enablement programmes.
Execution is where capability meets the pipeline. This covers the deal lifecycle from creation through progression, commit discipline, renewals, and any technical proof or investment activity that converts to commercial outcomes. The question here is not whether sellers are busy, but whether deals are moving at the velocity and conversion rate required to support predictable revenue delivery.
Outcomes are the results the business is ultimately accountable for: growth, efficiency, customer health, and retention. These are lagging indicators. They tell you what happened. The value of the engine is that by the time an outcome metric moves, you’ve already been inspecting the inputs, capabilities, and execution domains that explain why.
Domains and KPI design
Within the four stages, the engine defines a set of domains, typically 15–20 depending on the business, each representing a distinct area of commercial focus. The design principle is deliberate: one primary KPI per domain, with two to four diagnostic measures sitting beneath it.
The primary KPI is the leadership-visible headline: comparable across regions, inspectable at the company or unit level, and simple enough that an executive team can hold it in their heads. When a CRO looks at the engine, they see 15–20 primary KPIs across the four stages. That’s the strategic layer.
The diagnostic measures are where the depth lives. They explain why a primary KPI is moving. If a primary KPI tracks pipeline coverage, the diagnostics might break down sourcing mix, stage velocity, or qualification rates. These are the metrics that front-line managers and RevOps use to identify root causes and assign specific coaching actions.
Diagnostics are also classified by measurability. Some are fully reportable from existing systems. Others require management observation or structured scoring. A third category, metrics that are theoretically valuable but operationally impractical, is explicitly avoided. This is an important discipline. Frameworks that include aspirational metrics no one can actually produce lose credibility quickly.
This structure gives you a KPI architecture that scales: 15–20 headlines for leadership, 50–80 diagnostics for the operating layer, and a clear line of sight between the two.
The management model: inspect, interpret, intervene
Visibility without management discipline produces nothing. The engine operates on a three-step model that applies to every KPI inspection, at every level.
Inspect: understand the current state at the right level of granularity, from company aggregate down to individual seller.
Interpret: determine whether what you are seeing is noise, a trend, or a structural problem. A single-period miss within historical range is very different from two consecutive periods below threshold across multiple units.
Intervene: assign a specific action to a specific owner with a defined follow-up point.
Most sales organisations stop at inspection. The engine is designed to prevent that by building interpretation and intervention into the cadence itself.
Intervention follows a severity logic. A single-period miss warrants observation. A repeated miss in one unit triggers targeted coaching. The same pattern across multiple units signals a systemic issue requiring leadership-level action. A sudden sharp deterioration in a single period calls for diagnosis before intervention, checking for data quality issues, personnel changes, or external events before assuming execution failure.
Each KPI also carries a management card: a structured reference that defines the business question it answers, what success looks like, the key inspection questions to ask in review, the recommended action pattern, and the cadence at which it should be reviewed. These cards are the bridge between the metric and the management behaviour, turning a number on a dashboard into a repeatable coaching conversation.
The inspection hierarchy
KPIs are read at four levels, each with a different lens:
Company: Is the engine performing overall?
Region: Which parts are outperforming or underperforming?
Manager: Are managers coaching to the right behaviours?
Individual seller: Is this person executing the motion?
Each level has a defined red-flag pattern and an intervention owner. This prevents the common failure mode where a metric is reviewed at the aggregate level but never drilled into far enough to identify who needs to change what.
As you move up the leadership chain, everyone retains the capability to go into the weeds when a signal warrants it, but each level also has a relevant, appropriately filtered view of what they need to run their part of the business. The engine doesn’t force a senior leader to navigate frontline complexity to find the signal. It doesn’t hide that complexity from them when they need it.
Three connected cadence loops
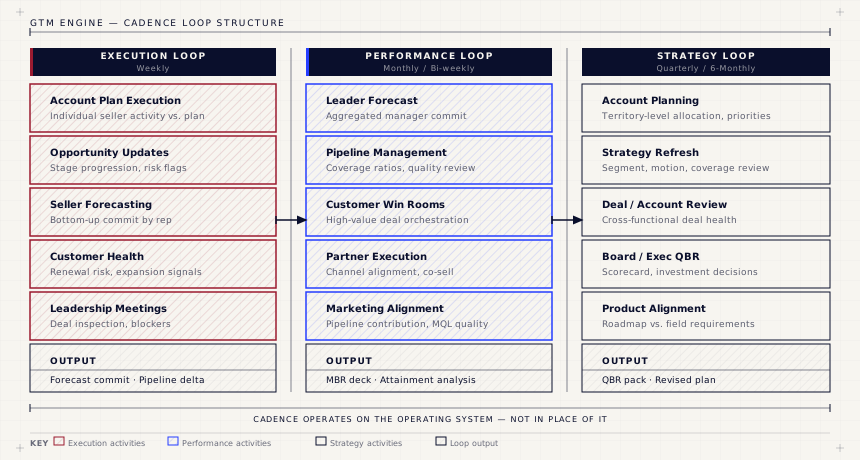
The engine is a cadence system, not a dashboard. Metrics only create value when they are inspected at the right frequency, by the right people, with authority to act.
The Execution Loop runs weekly. This is the front-line heartbeat: opportunity management, deal updates, customer health signals, forecast submissions, and front-line manager one-to-ones. The principle is straightforward: when managers are rigorous on deal updates and disciplined on customer plan execution, they give leadership the signal clarity to make better resource decisions.
The Performance Loop runs bi-weekly or monthly. This is where cross-functional inspection happens: pipeline quality and velocity, forecast accuracy, customer health, marketing contribution, partner engagement, and commercial conversion. This loop has formal authority to redirect, assigning coaching actions, flagging enablement gaps, or escalating structural issues. The pipeline review, in particular, shifts focus from pipeline volume to pipeline quality and sourcing mix.
The Strategy Loop runs quarterly. This covers course correction and forward alignment: strategic account reviews, top deal reviews, product alignment sessions, and leadership QBRs that feed into board reporting. This is where the engine connects back to the strategic direction that shaped the inputs at the top.
The three loops nest inside each other. Weekly execution data feeds the monthly performance inspection. Monthly patterns inform quarterly strategic decisions. The architecture ensures that nothing is reviewed without context, and nothing is decided without evidence.
A well-run cadence creates productive discomfort. It surfaces where the territory design is wrong, where the pipeline is optimistic rather than real, where the incentive plan is producing behaviour nobody intended. A cadence that avoids those conversations is likely concealing structural challenges or underperformance. The operating system underneath has to be owned, not just observed, and governance has to run from the executive team through sales leadership to the field. RevOps cannot hold accountability in place alone. Organisations discover that the hard way.
Playbooks and battle cards
Within each domain, the engine supports a layer of playbooks and battle cards that front-line managers and sellers use to address specific situations. These are practical tools, not process documentation: a specific coaching action for a specific signal, a defined response to a specific deal situation, a structured approach to a specific customer conversation.
Teams almost always understand their own process well. They rarely understand how their process connects to the function upstream or downstream from them. Sellers think about pipeline. Marketers think about demand. Customer success thinks about retention. The engine makes those dependencies visible: input here becomes output there, which is the input for the next function. When people see their contribution in the context of the full system, behaviour changes, because the connection is now visible and their part in it is clear.
As playbooks develop across domains, the organisation starts to build a genuine system-thinking capability. Teams understand what to do in their area and why it matters to the areas adjacent to them.
You have to build it. Make the data work.
The most common reason GTM engines don’t get built is the belief that you need complete data before you can start. You don’t.
A team can design and deploy a functional engine in months, not years. You start with the strategy and the data foundations you have. Where instrumentation is missing, you name the gap and build toward it, but you run the engine in the meantime. An incomplete puzzle with the right architecture is more useful than a complete dataset with no frame to put it in. You can inspect what you have, identify what’s missing, and prioritise the data and systems work that will close the gaps fastest.
The cadence creates the discipline. The discipline exposes the gaps. The gaps drive the data work. That sequence is the point, and it only starts when you commit to running the engine rather than waiting until it’s fully built.
In organisations where this lands well, you sometimes encounter a reaction from experienced operators that’s genuinely surprising. People who’ve spent years assuming the complexity of the business would prevent them from ever having a clear view of it discover that it doesn’t have to. The engine doesn’t make the business simpler. It makes the system legible. For people who’d written off that possibility, that’s a meaningful shift.
Why it works
The engine works because it makes a set of dependencies visible and therefore manageable. Weak inputs starve the engine. Capability gaps mean you can’t convert. Poor execution wastes potential. The four-stage structure forces a leadership team to balance all elements in parallel: coaching capability, inspecting execution, feeding the front of the engine, and aligning teams in the same direction.
It also works because it respects the limits of human attention. A leadership team can’t hold 80 KPIs in active memory. They can hold 17 primary KPIs across four stages, inspect them at the right frequency, and drill into diagnostics when a signal warrants it.
And it works because it doesn’t require the organisation to be ready. You build it from where you are. You instrument as you go. The parts that exist start producing signal immediately. The parts that don’t exist get prioritised by the gaps the engine exposes.
Most commercial organisations have more performance available inside their existing model than they realise. The gap between what the engine could produce and what it is producing is usually a system problem, not a strategy problem. Building the engine well is how you close it.